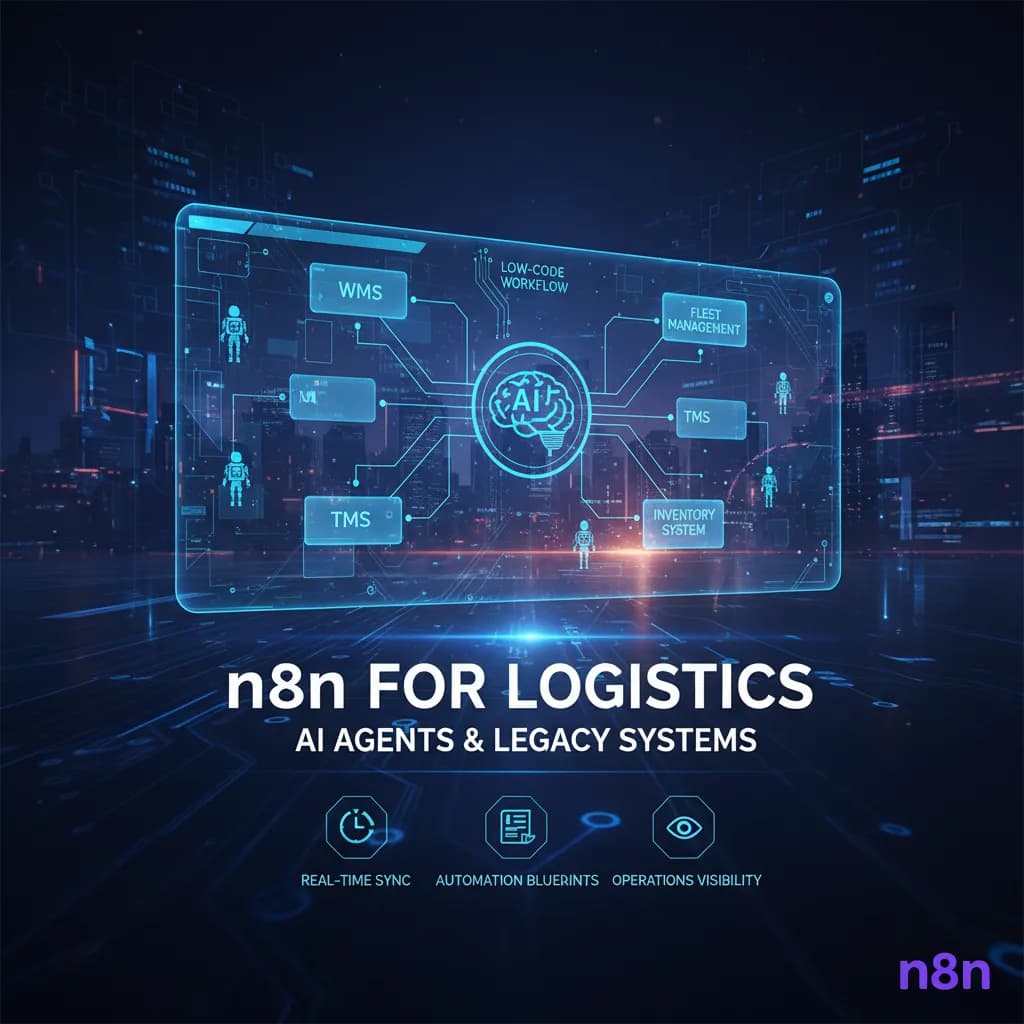
Imagine it's midnight. Your warehouse just received a massive surge of orders that needs to be processed immediately. In the old days, this meant waking up your team and scrambling to handle everythin
Ponvannan P
Jan 23, 2026 • 8 Minutes Read
Jan 21, 2026
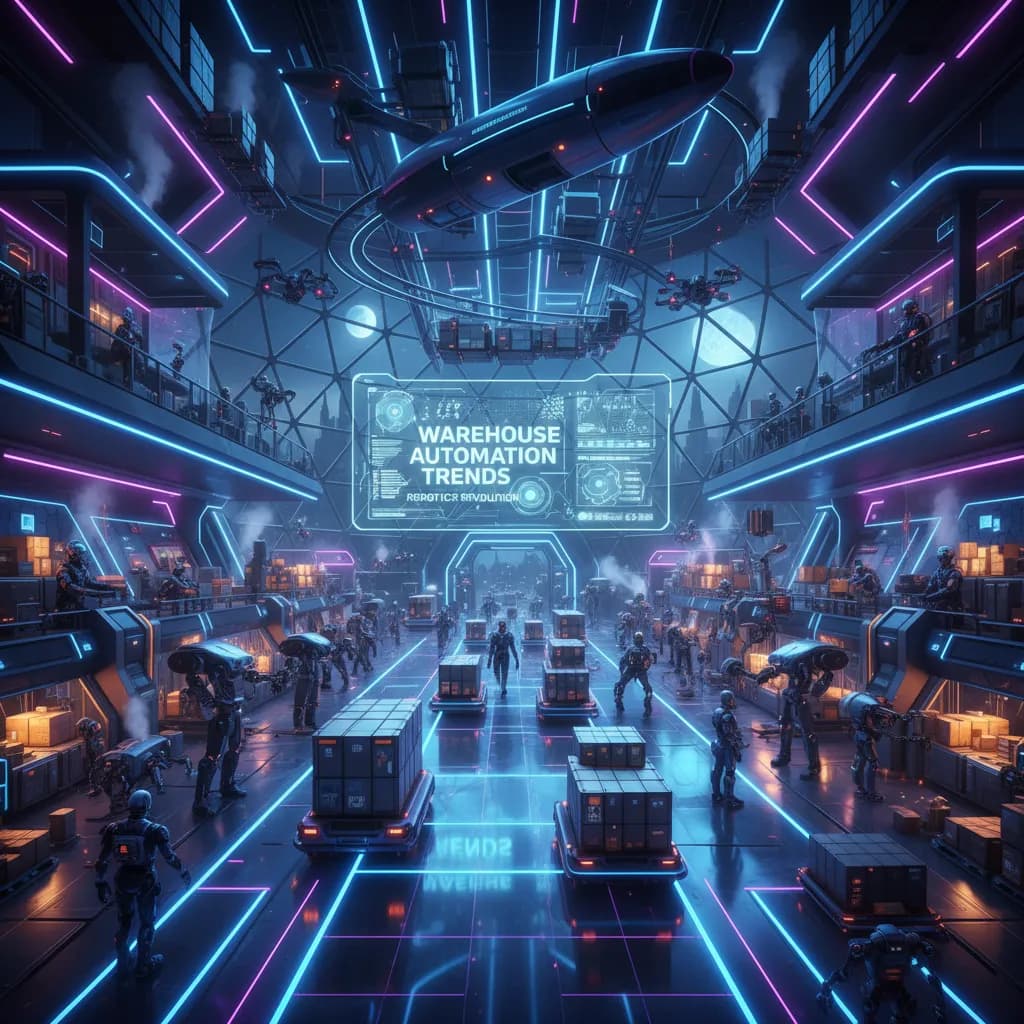
By 2026 the warehouse floor looks different than a decade ago: smaller teams, smarter machines, and a nervous but curious balance between human judgme
10 Minutes Read
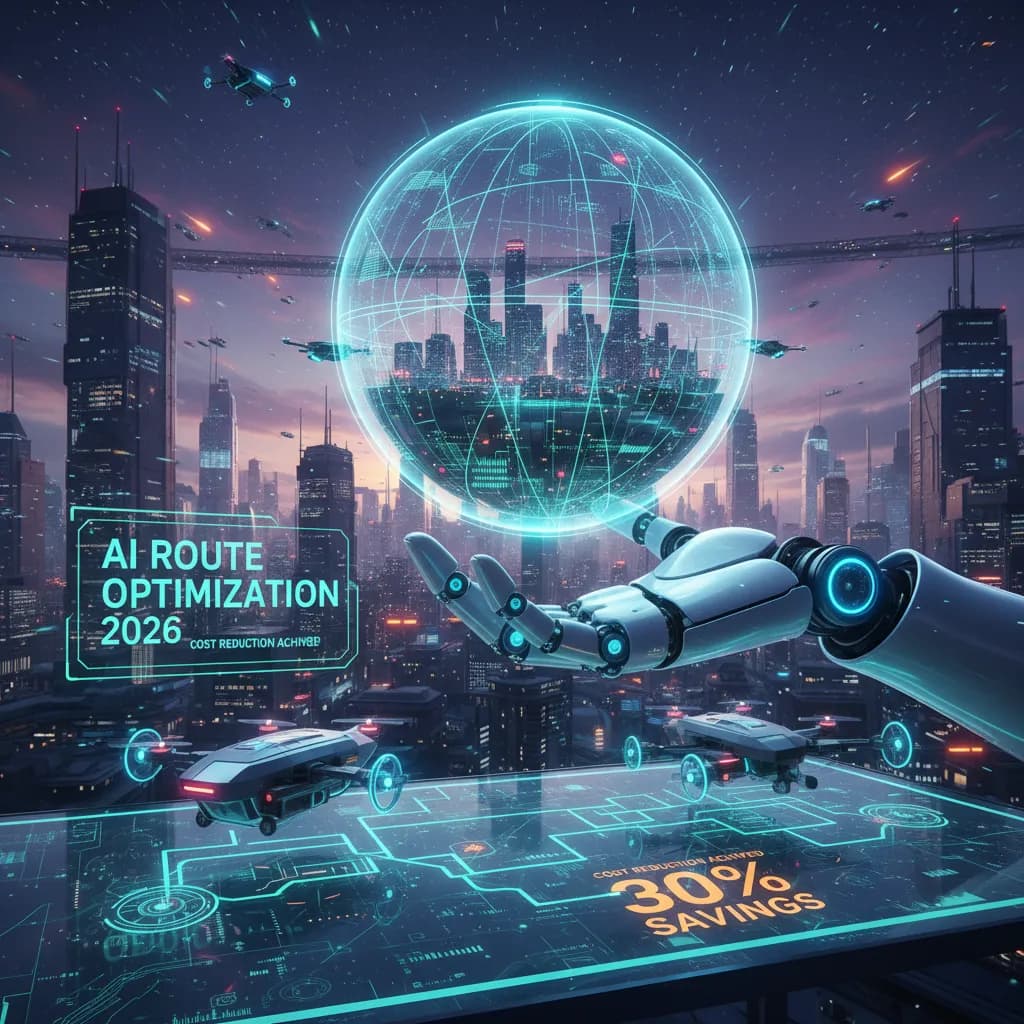
The piece opens with a brief, human-flavored anecdote about a regional dispatcher who once spent entire mornings manually reworking routes for a 60-tr
13 Minutes Read
A procurement director at a mid-sized food manufacturer watched a week of spoiled inventory evaporate into a mandate: invest in visibility or accept r
The piece opens by re-examining pandemic-era shocks—COVID-19 as a hard lesson—and maps how brittle, siloed supply chains faltered. It argues that toda
12 Minutes Read
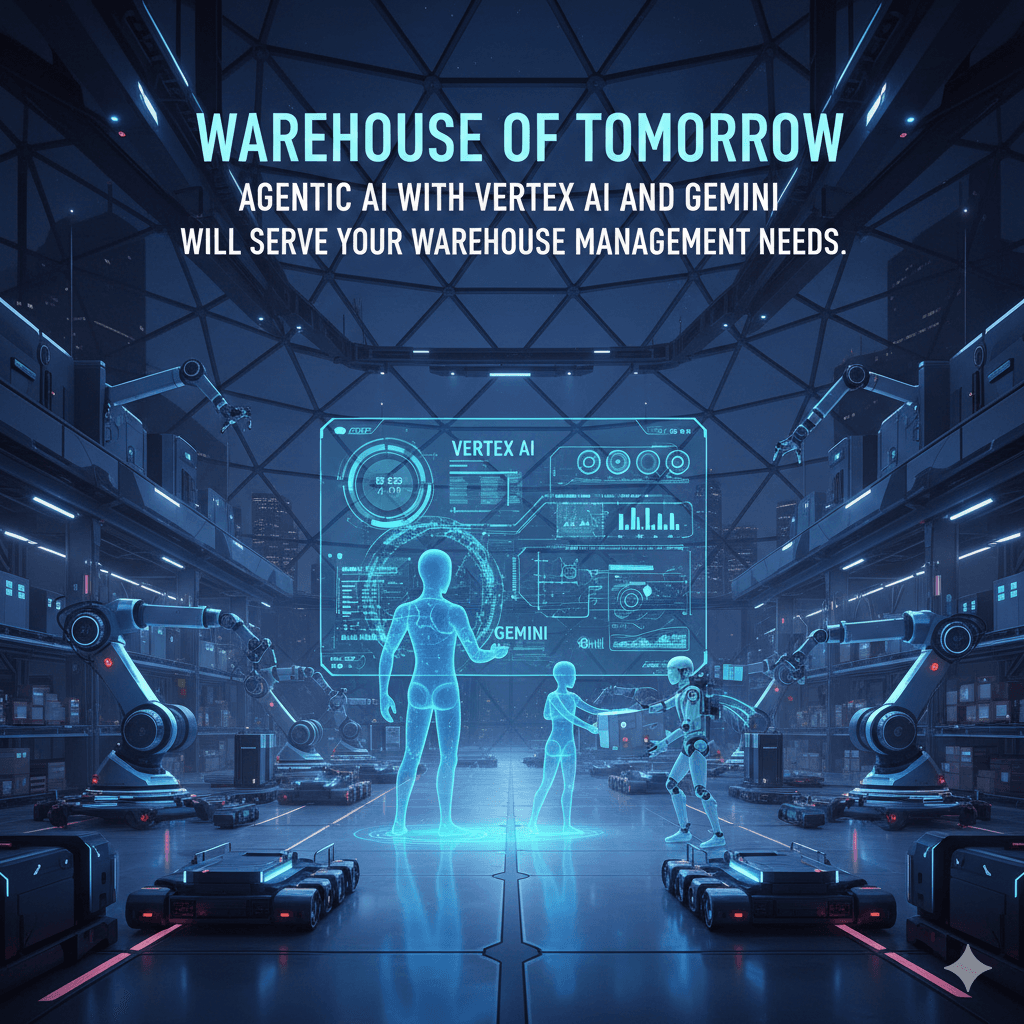
IntroductionPicture this: It's 2 AM in a major distribution center, and a critical shipment arrives six hours ahead of schedule. Simultaneously, three
23 Minutes Read
Nov 18, 2025
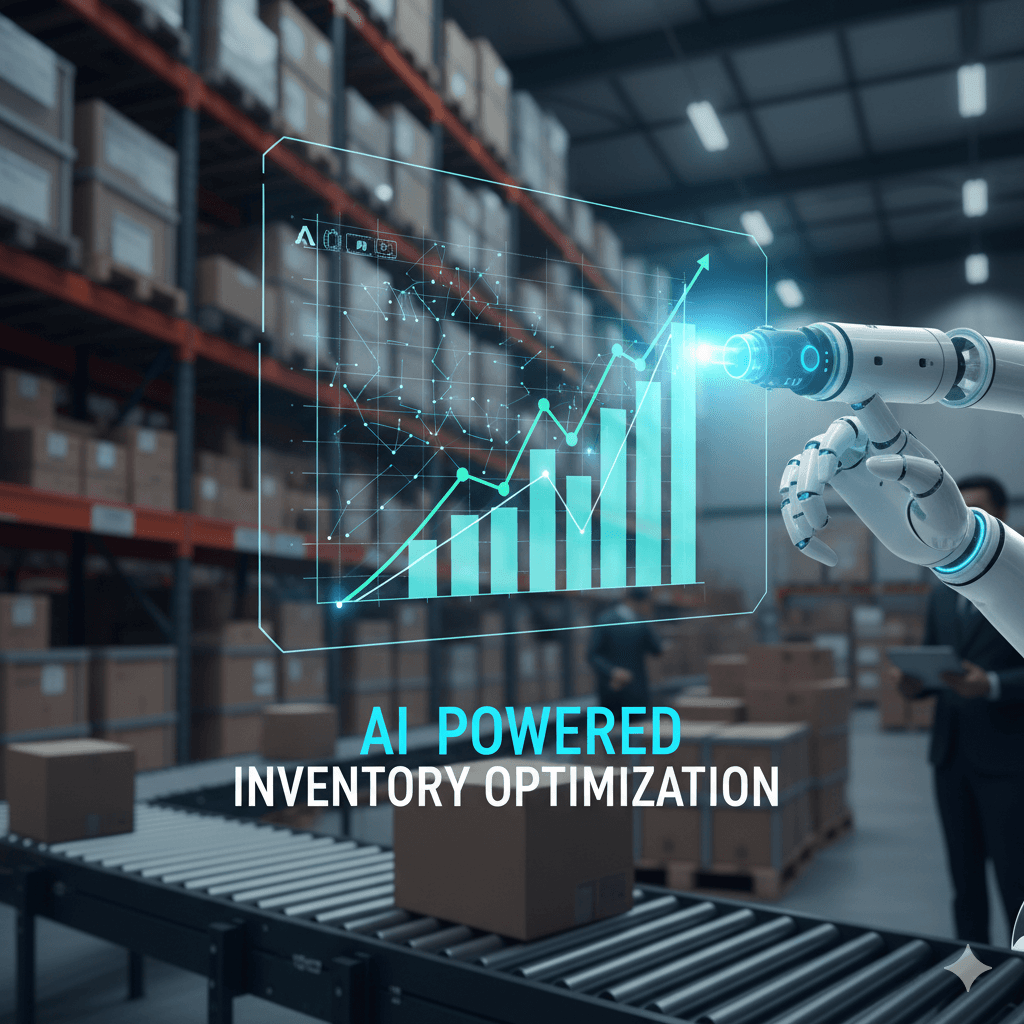
AI-Powered Inventory OptimizationIntegrating Google Gemini with Predictive Analytics, Statistical Models, and Machine Learning for FMCG & Ecommerc
22 Minutes Read
Nov 10, 2025
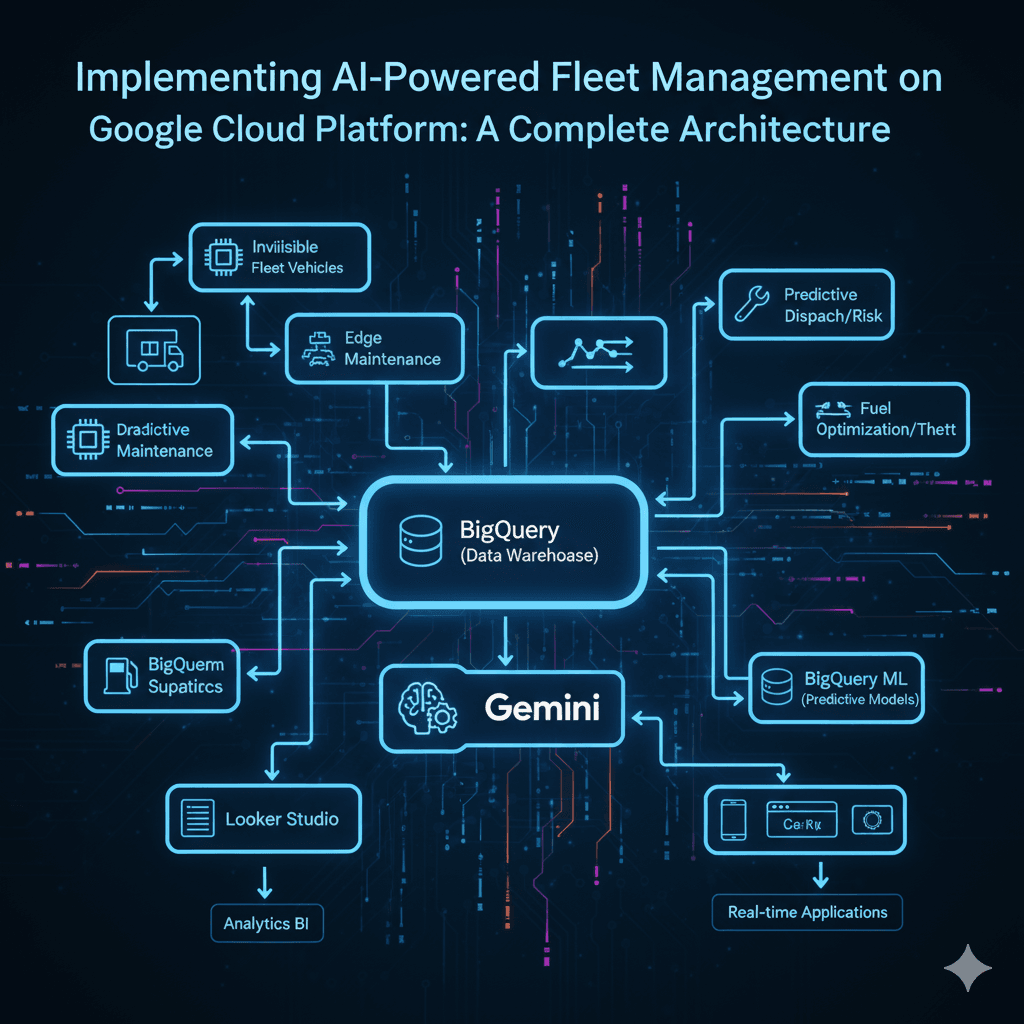
A Comprehensive Guide to Building Intelligent Fleet Operations with GCP's AI StackExecutive SummaryModern fleet management faces unprecedented challen
27 Minutes Read
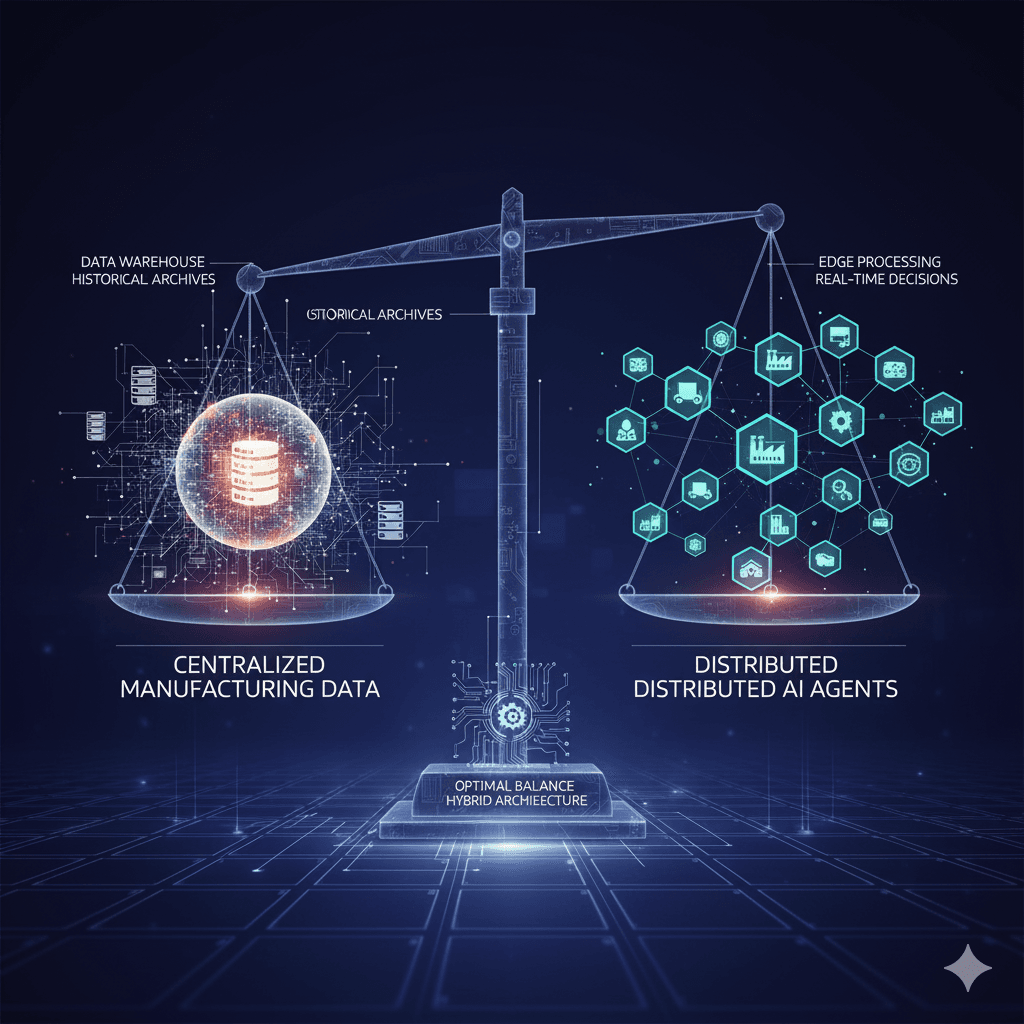
Architecting Intelligent Supply Chains: From Data Gravity to Distributed AI OrchestrationA Comprehensive Framework for Implementing Multi-Agent AI Sys
14 Minutes Read
Oct 8, 2025
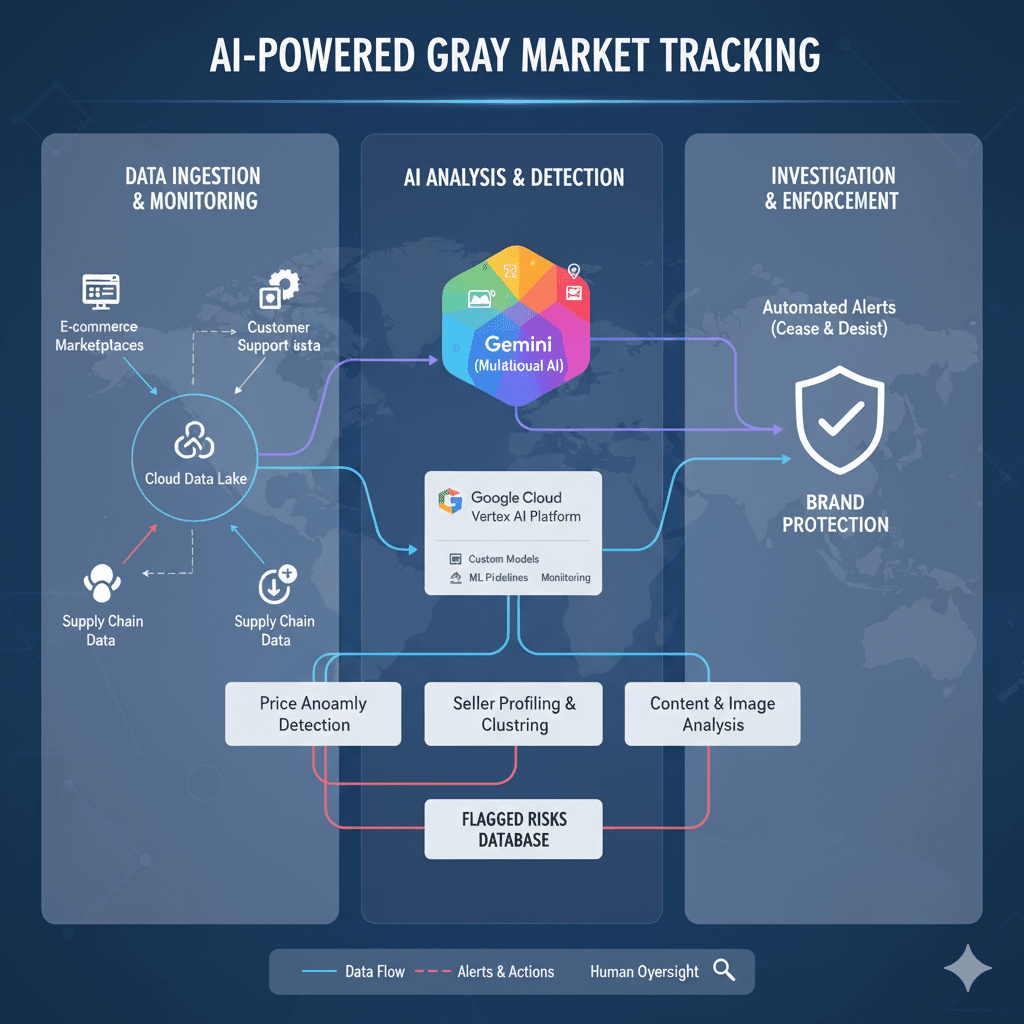
Tracking gray market activity and transshipment is a complex challenge for brands selling products online. These unauthorized sales channels erode bra
9 Minutes Read
Sep 30, 2025
Back when I worked third shift at a bustling distribution center, it always amazed me how a single equipment breakdown could create domino chaos for h
8 Minutes Read